LOVER
Paid Acquisition Case Study
Rebuilding Paid Growth Into a Revenue Engine
I restored Facebook acquisition in July, rebuilt LOVER’s paid-growth engine and connected media scaling to revenue and subscriber economics.

LOVER
Paid Acquisition Case Study
I restored Facebook acquisition in July, rebuilt LOVER’s paid-growth engine and connected media scaling to revenue and subscriber economics.
Facebook was still offline when I joined. I spent May and June rebuilding the acquisition foundation, then restored the channel in July.
At the same time, iOS privacy changes, new pricing and a three-day trial changed the funnel. Growth had to be measured through revenue and subscriber CPA—not installs alone.
Revenue grew every month from September through December: +61%, +36%, +34% and +20%. Q4 finished 124% above Q3 while CPA fell by approximately half.
From July through December, paid installs increased 373%, free trials increased 518%, paid subscriptions increased 233% and CPI improved 30%.
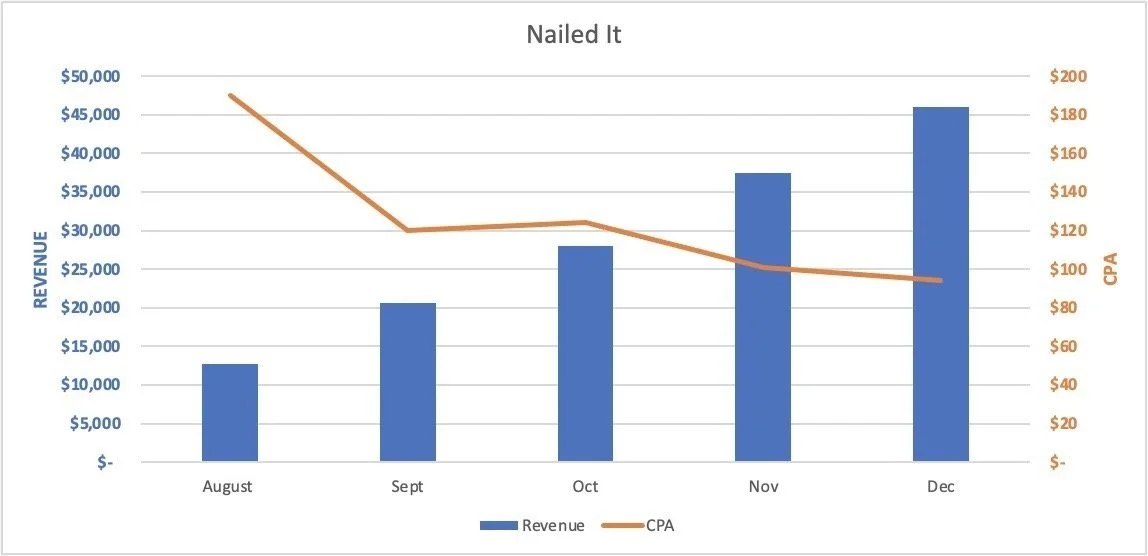
Exit Analysis: Revenue Up. CPA Down.

Top-Performing Facebook Creative
I designed this graphic and the FDA Safer Technologies logos. It remained LOVER’s top-performing Facebook creative for nine months after my exit.